Overview
The Ops Platform is an integrated monitoring and diagnostics system for private deployment editions. It provides metrics, logs, traces, and intelligent alerts for HAP/HDP private environments. The Ops Platform connects to monitored targets out of band. It does not change business systems or collect business data, and helps operations teams view infrastructure, middleware, containers, Kubernetes clusters, and business microservices in an internal network.
The Ops Platform focuses on the following problems:
- Unified monitoring entry point: View host resources, middleware performance, Kubernetes object status, service logs, and external Web UIs mounted as custom pages (such as Flink) in one place.
- Closed-loop troubleshooting: Correlate metrics, logs, traces, and slow-query diagnostics to reduce switching between multiple tools.
- Alert consolidation: Built-in alert rules, status noise reduction, notification channels, and alert history support the full flow from anomaly detection to recovery confirmation.
- Private delivery: The Ops Platform supports both Docker Compose standalone deployment and Kubernetes cluster deployment. It usually follows the deployment form of the HAP/HDP environment it serves, with data kept inside the customer's internal network by default.
Feature Overview
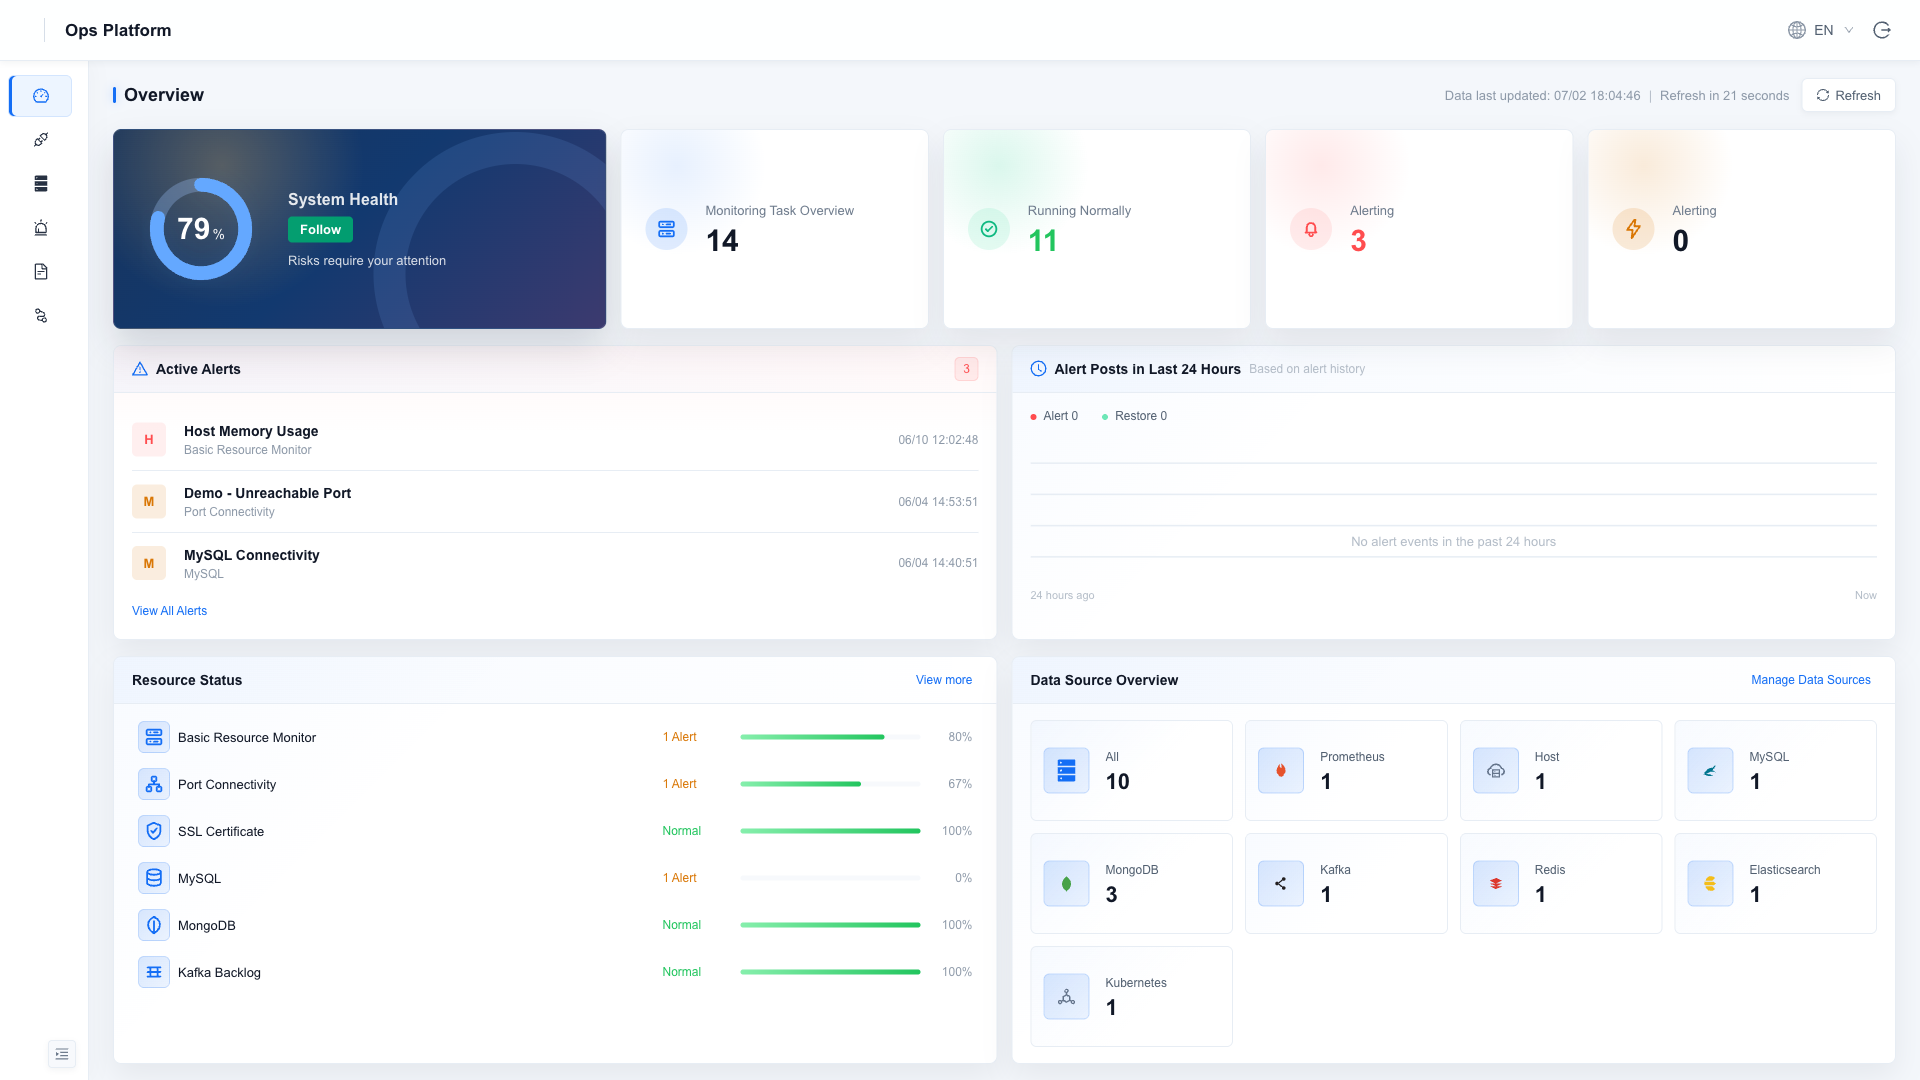
| Module | Capability | Documentation |
|---|---|---|
| Overview | System health, monitoring task statistics, active alerts, and alert activity over the last 24 hours | This page |
| Resource Monitoring | Dashboards for hosts, MySQL/MongoDB/Redis/Kafka/Elasticsearch middleware, Kubernetes clusters, plus external Web UIs mounted as custom pages (such as Flink) | Resource Monitoring |
| Alerts | Native alert rules for seven scenario types, built-in noise reduction, and multi-channel notifications | Alert Rules |
| Logs | Loki-based container log and structured microservice log search | Log Search |
| Tracing (cluster deployment only) | Tempo-based distributed trace analysis (request rate/error rate/latency/waterfall). Standalone deployment does not provide this capability | Tracing |
| Slow Query Diagnostics | Automatic MongoDB slow-query analysis and index recommendations | MongoDB Slow Query Analysis |
When the Ops Platform is deployed in Kubernetes form, it usually reuses the existing HAP/HDP Kubernetes cluster. Its built-in Prometheus directly collects that cluster (ENV_K8S_MONITOR_MODE=incluster) through ServiceAccount-based discovery, without Token or NodePort. Data is collected automatically after deployment.
If the Ops Platform is not deployed inside the target HAP/HDP Kubernetes cluster (for example, the Ops Platform uses standalone deployment), or if it needs to monitor multiple Kubernetes clusters, deploy one set of collection components in each monitored cluster.
Metrics are pushed back to the Ops Platform through remote_write; the only requirement is outbound access from the monitored cluster to the Ops Platform.
See Kubernetes Cluster Monitoring.
Technical Architecture
The Ops Platform uses Prometheus + Grafana as the core for metrics and visualization, and integrates Loki (log aggregation), Tempo (distributed tracing), and Grafana Alloy (unified collector). Metrics, logs, and traces are aggregated into Grafana for unified query:
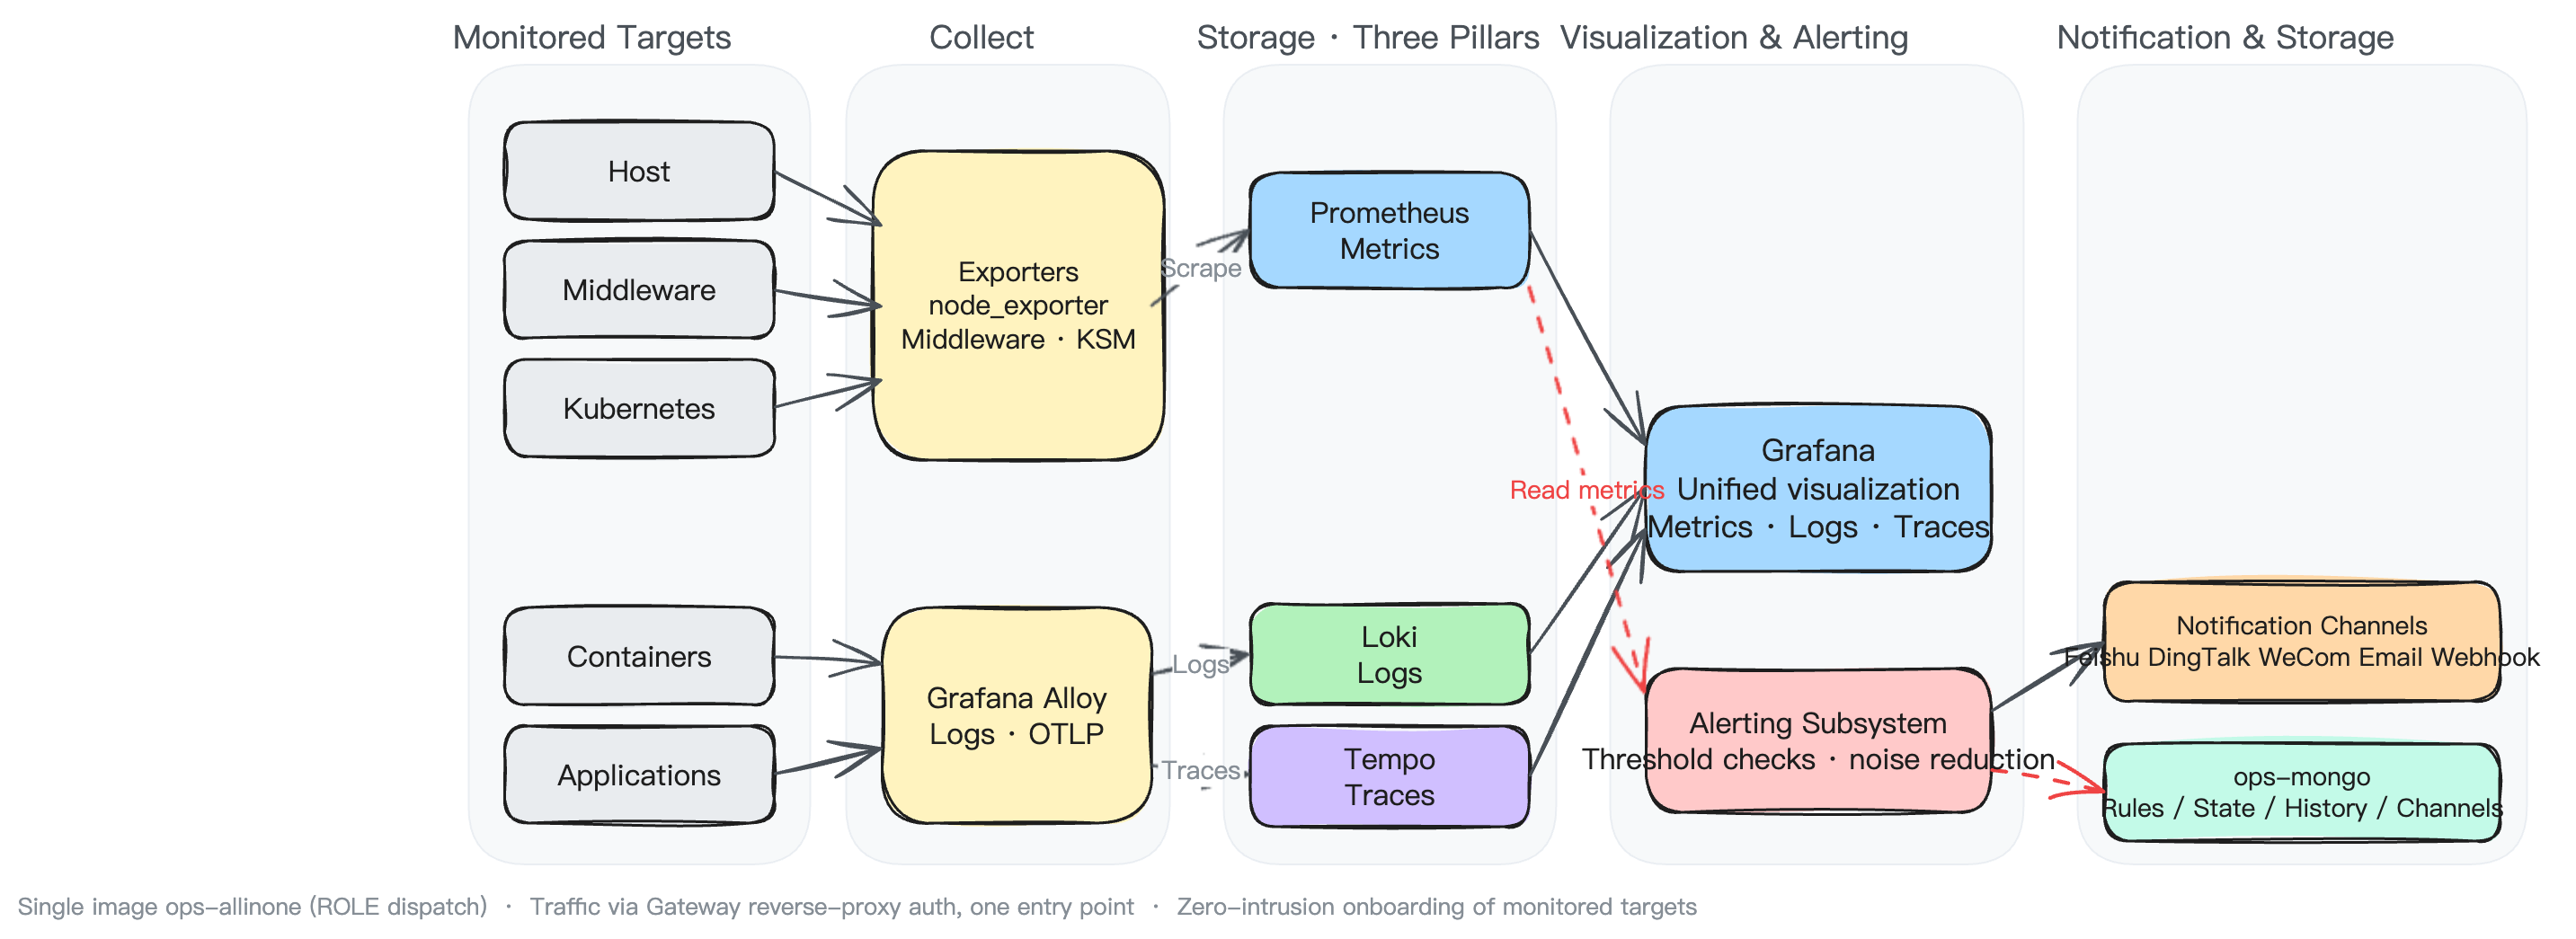
Data flow:
- Metrics: node_exporter (hosts), middleware exporters, and kube-state-metrics (Kubernetes objects) are scraped and stored by Prometheus.
- Logs: container stdout is collected by Alloy, while microservice logs are pushed directly by serilog. Both are written to Loki.
- Traces: applications report through OTLP to Alloy, which forwards traces to Tempo.
- Visualization and alerts: Grafana reads the above data sources for dashboards. The Ops Platform's self-developed alert subsystem is independent from Grafana and periodically evaluates rules and sends notifications through multiple channels.
Component Versions
| Component | Version | Purpose |
|---|---|---|
| Prometheus | 3.1.0 | Metrics collection and storage |
| Grafana | 12.2.1 | Unified visualization UI |
| Loki | 3.5.8 | Log aggregation and search |
| Tempo | 2.9.0 | Distributed trace storage |
| Grafana Alloy | 1.11.3 | Unified observability collection (container logs/OTLP) |
| node_exporter | 1.8.2 | Host resource metrics |
| kube-state-metrics | 2.10.1 | Kubernetes cluster object status |
| Middleware exporters | kafka 1.6.0/elasticsearch 1.5.0/redis 1.44.0/mysqld 0.15.1/mongodb 0.42.0 | Middleware performance metrics |
| MongoDB | 4.4.28 | Alert subsystem storage (decoupled from monitored targets) |