Log Search
Loki-based log search provides two panels under "Log Management" in the left sidebar, separated by source:
| Panel | Source | Use Case |
|---|---|---|
| Container Console | Docker container stdout/stderr (collected by Alloy) | Troubleshoot middleware and infrastructure container logs, such as MySQL/Redis/Kafka |
| Service Logs | Structured JSON logs pushed directly by HAP/HDP microservices through serilog | Troubleshoot business calls, exception stacks, and search by parameters such as phone number/user ID/traceID |
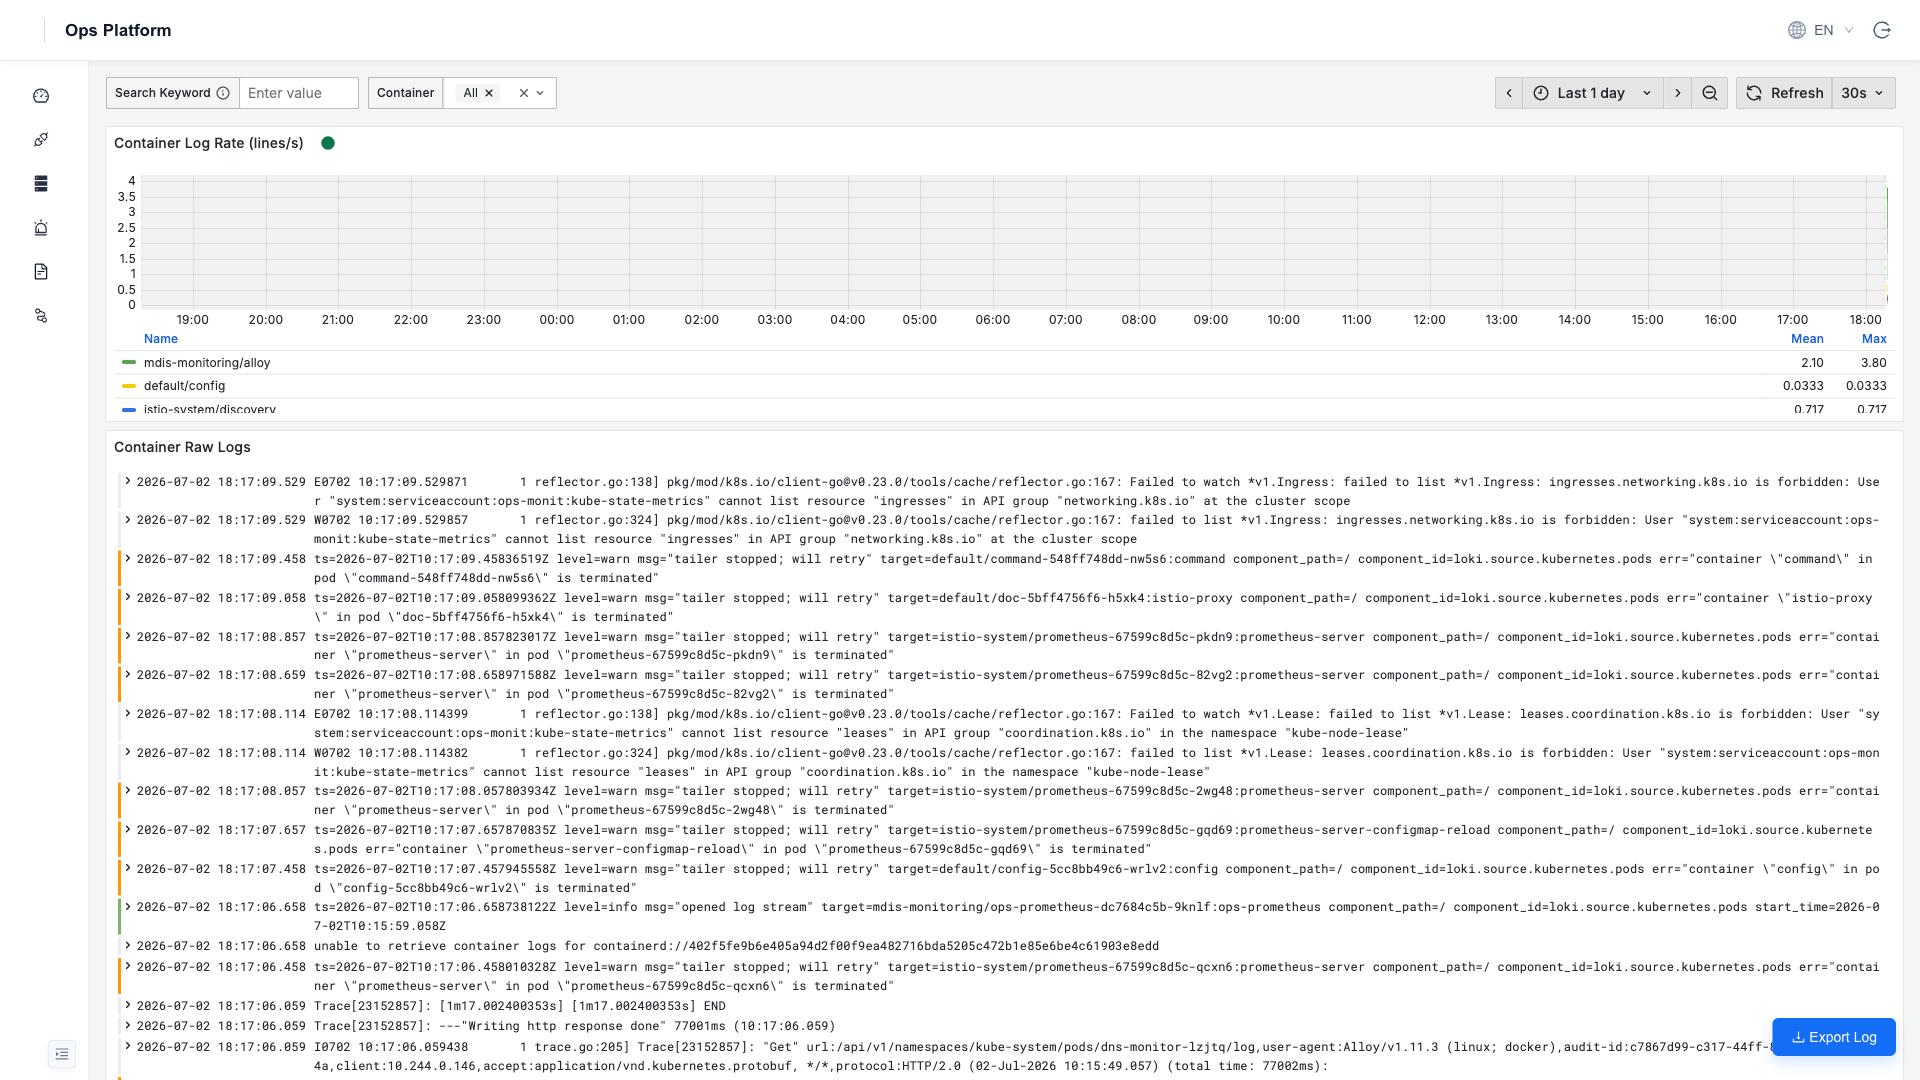
Both panels provide keyword search (full-text, case-insensitive) and multi-select filters at the top. The default time window is the last 1 day and can be adjusted in the upper-right corner.
Container Console
Select a container name (for example, script-app-1 or milvus-etcd) from the "Container" dropdown to view recent stdout for that container. Use keywords to locate specific content.
Service Logs
"Service Logs" queries structured logs pushed directly to Loki by HAP/HDP microservices through serilog.
Not Connected Yet?
"Service Logs" requires enabling the write switch on the HAP/HDP service side. Otherwise this panel has no log data. See Service Log Ingestion for the connection steps.
Advanced LogQL
For complex queries (aggregation/statistics/regex), open Grafana Explore (Grafana icon in the lower-left corner → Explore) and write LogQL directly:
{service_name="smssenderservice", detected_level="error"}     # All errors from the SMS service
{hostname=~".+"} |~ "(?i)13800138000"                          # Search a phone number across all microservices
sum(rate({hostname=~".+"}[5m])) by (service_name)              # 5-minute log rate by service
See the official LogQL documentation for syntax.
Logs are retained for 30 days by default (ENV_LOKI_RETENTION=720h). This can be adjusted in ops.yaml/ConfigMap. When disk capacity is limited, configure an S3/MinIO backend.