Monitoring Architecture
Overview
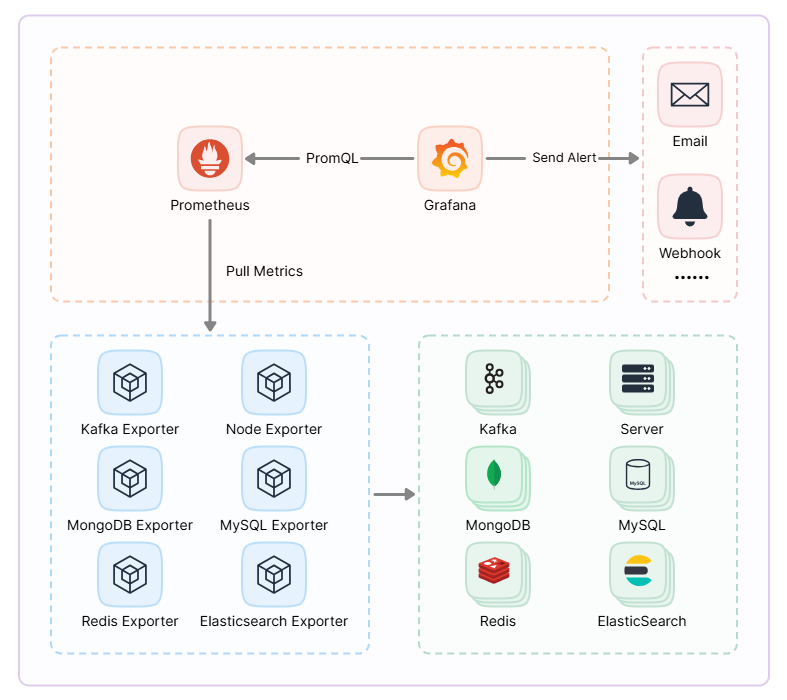
The monitoring capabilities of the Ops Platform are built on Prometheus v3 and Grafana v11, providing efficient, stable data collection, storage, and visualization solutions to fully meet the monitoring needs of various infrastructure and applications.
Architecture Diagram
Architecture Introduction
Data Collection
Monitoring Objects and Exporter Components
The platform utilizes the Prometheus Exporter mechanism to achieve comprehensive data collection for critical infrastructure and applications. Each Exporter component is responsible for exposing the monitoring metrics of the target system to the Prometheus Server in a standard format.
| Monitoring Object | Exporter Component | GitHub Maintainer |
|---|---|---|
| Host System | Node Exporter | Prometheus |
| Message Queue | Kafka Exporter | danielqsj |
| Search Engine | Elasticsearch Exporter | Prometheus Community |
| Cache Service | Redis Exporter | Oliver006 |
| Relational Database | MySQL Exporter | Prometheus |
| Document Database | MongoDB Exporter | Percona |
Collection Strategy
- Active Pull Mode: Prometheus Server periodically pulls data from each Exporter endpoint according to a preset configuration, ensuring real-time and accurate data collection.
Data Storage and Visualization
-
Data Storage: Prometheus TSDB (Time Series Database) efficiently stores the collected monitoring data, supporting data compression and fast querying.
-
Data Visualization: Grafana provides rich visualization components, supporting multidimensional dashboard customization and data analysis, helping users intuitively display and gain insights from the monitoring data.
Alerts and Notifications
Alerts
-
Unified Management: Configure alert rules through Grafana to achieve real-time monitoring and automatic alerts for abnormal situations.
-
Based on PromQL: Use PromQL to query monitoring data in Prometheus, constructing flexible alert rules.
- PromQL: The Prometheus Query Language (PromQL) allows users to perform efficient querying and aggregation on time series data, providing strong support for monitoring analysis and alerts.
Notifications
- Multi-channel Support: The system supports various alert notification methods such as email, DingTalk, WeChat Work, Webhook, ensuring that Ops personnel can receive abnormal information promptly and respond in a timely manner.